Is there much wealth mobility in New Zealand?
There has been lots of coverage yesterday and today of my latest wealth inequality research (carried out with my father and Wilma Molano from Statistics New Zealand), most of it focusing on our findings about the very limited amount of assets that the average person owns.
However, we also looked at mobility – that is, whether people move up and down the wealth spectrum over time, whether they go from being poor to wealthy, or vice versa.
Below is a table which is slightly difficult to interpret for the lay person, but which shows what happens to people in the different quintiles (that is, fifths of the population) over the six years of survey data that we analysed.
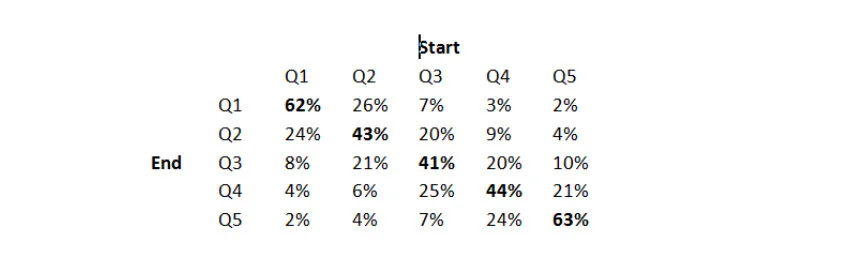
Source: Rashbrooke, Rashbrooke and Molano, ‘Wealth Disparities in New Zealand: Final Report’ (http://igps.victoria.ac.nz/publications/files/5327cc2a82f.pdf).
Q1 represents the poorest fifth of the population, Q5 the wealthiest. Each column takes one fifth of the population and shows which group they ended up in after six years. For instance, of those who started in the poorest fifth (the Q1 column), 24% ended in the next group up, while just 2% ended up in the wealthiest group.
The figures in bold are the percentage of each group who stayed in the same position across six years. As you can see, over that period, over 60% of people in the poorest and richest groups stayed where they were, but just over 40% for the middle groups. That’s not surprising: you’d expect it to be relatively easy to move up and down the middle class groups, but for rich and poor to be more fixed.
The data show a ‘diminishing decay’ – people continue to move up and down as the years go on, but once those most likely to move have done so, only a few more extra each year change position. Predicting that trend forward 20 years (using some maths described in the paper), we suggested that around 55% of the wealthy and poor people surveyed would not move over two decades, and 35% of the three central groups would also not move.
What does one make of this? Both glass half empty and glass half full responses are possible. One could say that this shows that very large numbers of people who are poor at one stage go on to become wealthier over their lives.
However, one could also say that it shows very large numbers of people remaining poor for very long periods. Personally, I focus on the latter response: while it is important to recognise what works well, the greatest effort has to go into dealing with the things that aren’t working well, and the significant entrenched poverty suggested by these findings is to me quite troubling.